
Your Client Service Delivery Dashboard provides a shared view of support activity and service performance. The goal is simple. We want your team and ours to have access to the same recorded information. This creates better visibility, fair accountability, and more productive conversations about what is working and what needs attention.
| Step | What to Do |
|---|---|
| 1. Accept the invitation | Open the ConnectWise welcome email and validate your email address. |
| 2. Create your password | Create your secure ConnectWise Single Sign-On password. |
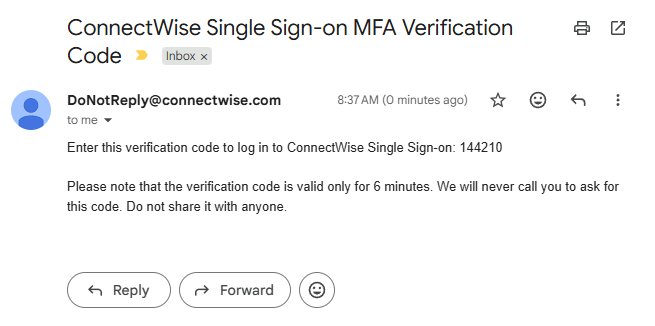
| 3. Complete verification | Enter the verification code sent to your email when prompted. |
| 4. Open BrightGauge | Launch BrightGauge to open your assigned dashboard. |
| 5. Bookmark the dashboard | Save the direct EasyITGuys BrightGauge address for future access. |
| 6. Explore the details | Click supported statistics and chart sections to review the tickets behind the results. |
Your dashboard uses ConnectWise Single Sign-On for secure access. The initial account activation is normally completed once.
Look for an email from ConnectWise with a subject similar to Welcome to your ConnectWise account. Select the link in the email to validate your email address.
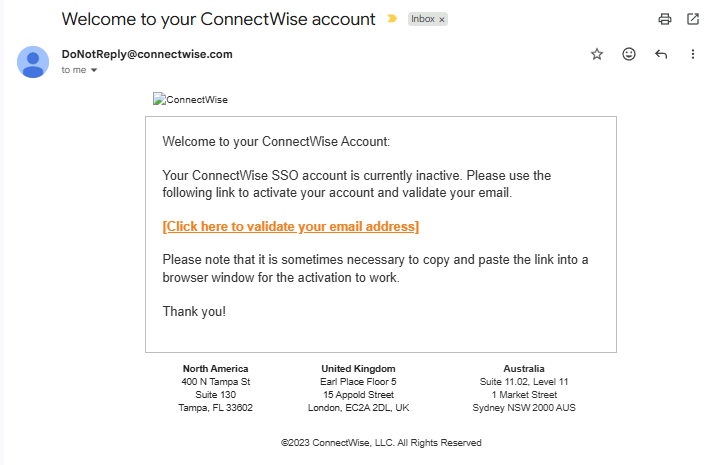
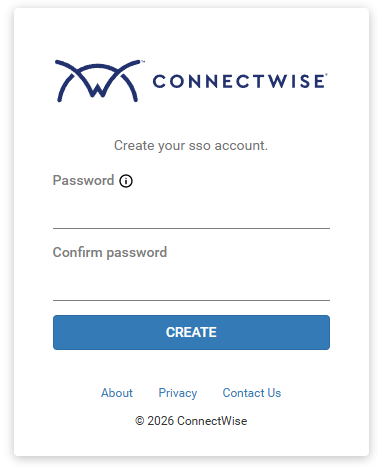
After validating your email, create and confirm your ConnectWise Single Sign-On password. Select Create when finished.
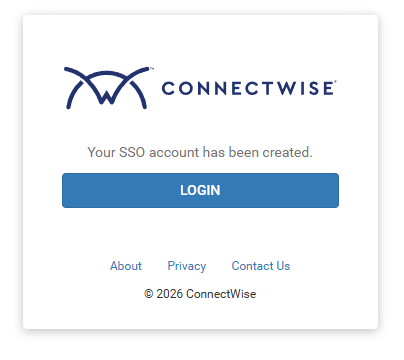
Enter the email address that received the dashboard invitation. Enter the password you just created and select Login.
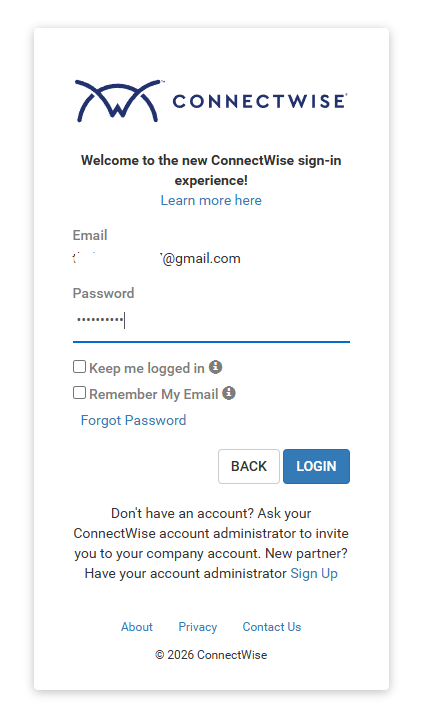
ConnectWise may send a six-digit verification code to your email address. Enter the code on the sign-in screen. The verification code is time sensitive, so use the most recent code if more than one has been received.

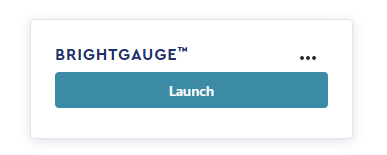
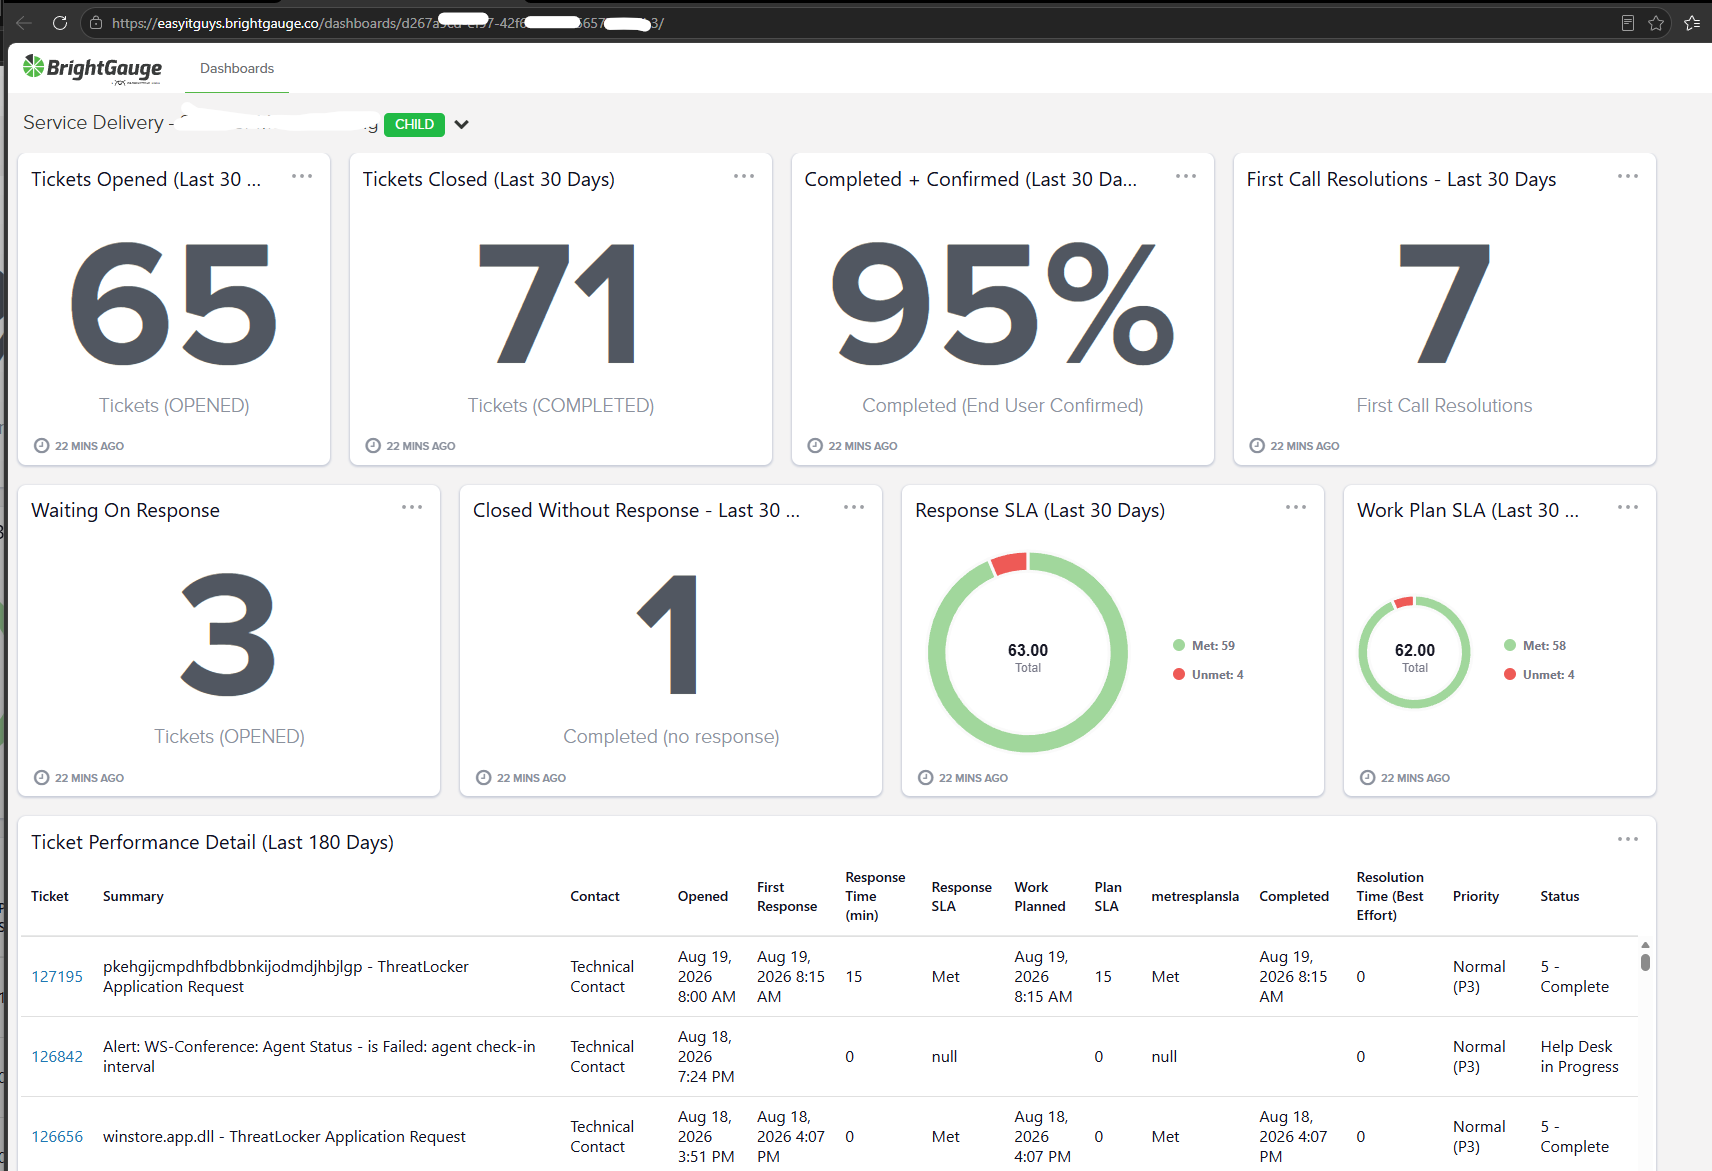
After authentication, select BrightGauge on the right side of the page, then select Launch. The other ConnectWise applications shown on this screen are not needed for dashboard access. Your assigned Client Service Delivery Dashboard will open. Many statistics and charts can be clicked to open the underlying ticket details.
If you see a ‘No Dashboards Assigned’ message, contact your account manager or the support desk for assistance.
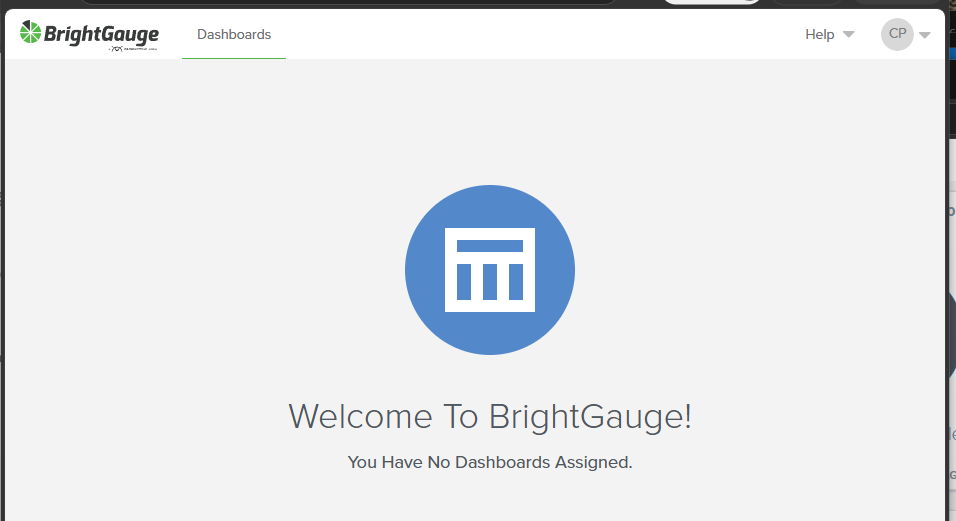
After your account has been activated, you can go directly to the EasyITGuys BrightGauge dashboard portal:
We recommend bookmarking this page. You do not need to intentionally navigate through the broader ConnectWise Home screen each time you want to review the dashboard. You may still be asked to sign in or complete account verification when required for security.
The dashboard gives your team and ours a shared view of recorded support activity. It helps both teams review service performance, identify items that need attention, and discuss specific tickets using the same recorded information.
Common questions the dashboard can help answer include:
| Dashboard Area | What It Shows |
|---|---|
| Tickets Opened | Qualifying support requests opened during the reporting period. |
| Tickets Closed | Qualifying support requests completed during the reporting period. |
| Completed + Confirmed | The percentage of applicable completed tickets that finished with end-user response or confirmation. |
| First Call Resolutions | Tickets recorded as resolved during the initial support interaction. |
| Waiting on Response | Open tickets currently waiting for information, confirmation, approval, or another response from the client. |
| Closed Without Response | Tickets closed after the client follow-up process did not receive the response needed to continue. |
| Response SLA | Whether the initial response met the applicable response target. |
| Work Plan SLA | Whether the recorded work-plan milestone met the applicable planning target. |
| Ticket Performance Detail | Ticket-level service history, milestones, SLA results, priority, and current or final status. |
Many dashboard statistics and chart sections are interactive. Click a supported number, chart section, or data point to open the ticket-level details behind that result.
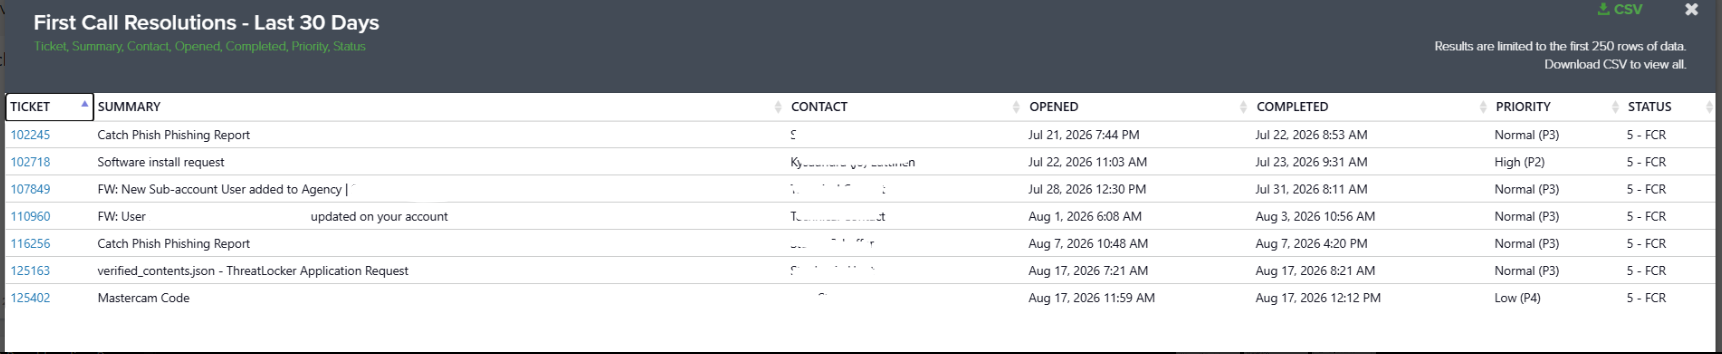
For example, clicking First Call Resolutions may show information such as:
Ticket | Summary | Contact | Opened | Completed | Priority | Status
Clicking the Met or Unmet portion of an SLA gauge can show the individual tickets behind that result when drilldown is available.
The Ticket Performance Detail section provides a broader historical view of qualifying support requests.
Depending on the ticket, you may see:
Child tickets, bundled or merged records, and duplicate records are excluded where applicable so the report focuses on meaningful top-level support requests.
| Field | What It Means |
|---|---|
| Opened | When the support request entered the service system. |
| First Response | When the initial support response milestone was recorded. |
| Response SLA | Whether the applicable initial-response target was met. |
| Work Planned | When the work-plan or resolution-plan milestone was recorded. |
| Plan SLA | Whether the applicable work-planning target was met. |
| Completed | When the applicable completion milestone was recorded. |
| Resolution Time | A best-effort operational measure. Resolution timing can be affected by scheduling, client availability, vendors, equipment, software providers, ticket complexity, and other dependencies. |
The dashboard intentionally separates the initial response from the work-planning milestone. A quick first response does not always mean that the complete work plan can be established at the same moment. Some requests require additional information, scheduling, review, escalation, or technical investigation.
| Measurement | Question It Answers |
|---|---|
| Response SLA | Did the initial response meet the applicable target? |
| Work Plan SLA | Was the work plan established within the applicable target? |
| Resolution Time | How long did the recorded resolution process take as an operational measure? |
You may occasionally see a blank field or the word null on an active ticket. This normally means that the applicable milestone or result has not been recorded yet.
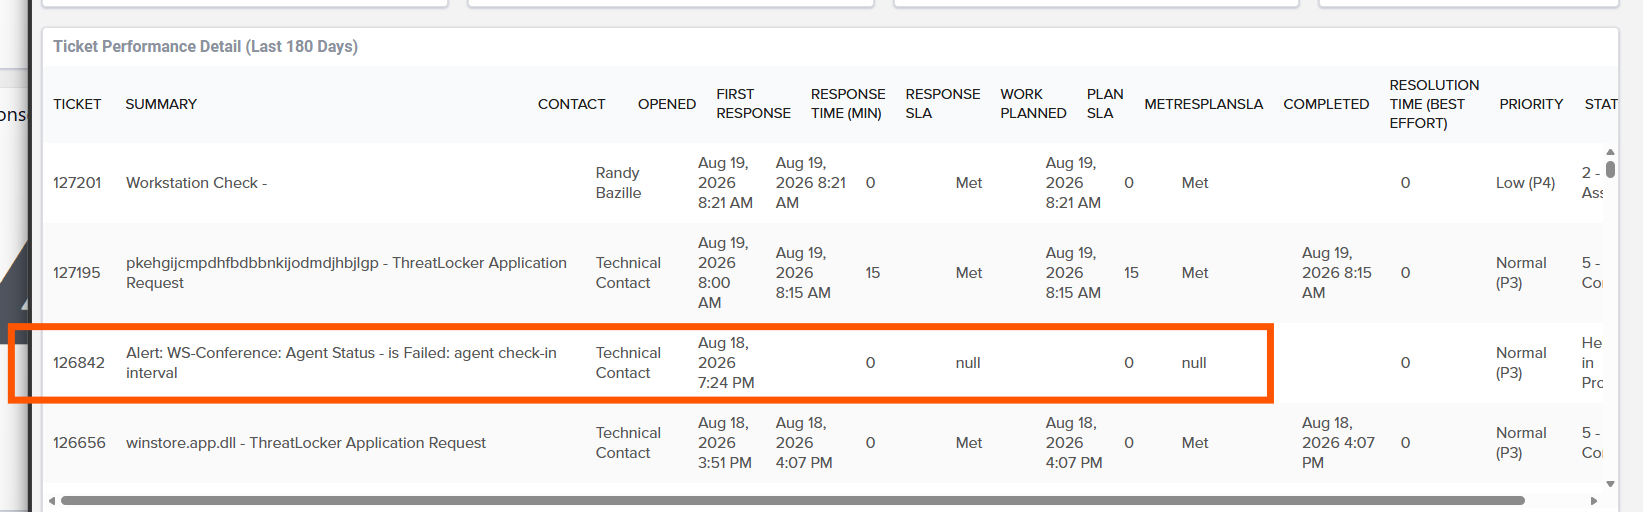
For example, a newly created or actively routed ticket may not yet have:
A blank or null SLA result does not automatically mean the SLA was missed. It means there is not yet a recorded Met or Unmet result for that milestone. Active tickets remain visible so the dashboard shows the current service picture rather than hiding work that is still moving through the process.
The dashboard is designed to provide near-real-time operational visibility, but it is not an instantaneous live feed. BrightGauge and the underlying service datasets refresh periodically. A ticket that was just opened, updated, reassigned, responded to, or completed may take some time to appear in the dashboard or reflect its newest status. This is normal. The dashboard should be used as a shared service-management view rather than as a second-by-second ticket monitor.
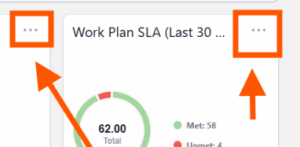
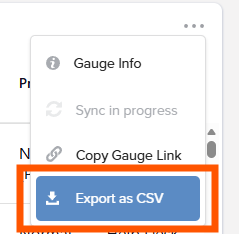
Many dashboard gauges include a three-dot menu (…) in the upper-right corner. This menu provides additional options for the specific statistic, chart, or ticket view you are reviewing.
| Option | What It Does |
|---|---|
| Gauge Info | Displays additional information about the gauge, including its description, reporting purpose, dataset, and refresh information. |
| Sync Now | Requests a refresh of the gauge data. The refresh may take a short time to complete and depends on the underlying dataset. |
| Copy Gauge Link | Copies a direct link to the individual gauge. Client access is normally provided through the assigned dashboard, so we generally recommend bookmarking and sharing the dashboard rather than individual gauge links. |
| Export as CSV | Downloads the available data behind the gauge into a CSV file for review in Excel or another spreadsheet application. |
Selecting Gauge Info opens the description for that dashboard item. This can help explain what the gauge includes, what it excludes, how the information should be interpreted, and how frequently the underlying data refreshes.

This is especially useful when reviewing SLA results, completion measurements, or historical ticket information.
The dashboard refreshes its underlying data automatically on a scheduled basis. If Sync Now is available, you can request an additional refresh for that gauge. The update is not always instantaneous. BrightGauge still needs to retrieve and process the latest information from the underlying service dataset.
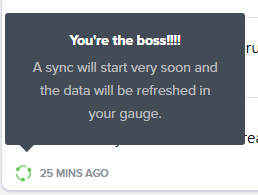
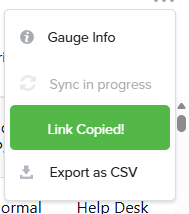
You may see a message indicating that the sync has started or is currently in progress.
The Copy Gauge Link option creates a link to an individual dashboard gauge. Client access is managed through the assigned read-only dashboard. For normal use, we recommend sharing or bookmarking the client dashboard rather than distributing individual gauge links. This keeps the reporting experience simple and ensures users work from the complete dashboard context.
Select Export as CSV to download the available records behind that gauge. The exported information reflects the filters and reporting period used by the gauge. This is useful when you want to sort, filter, or review the underlying ticket data outside the dashboard.
Any authorized viewer with access to the dashboard can export available ticket data as a CSV file at any time. This gives your team an on-demand reporting option whenever you want to inspect activity, validate service history, prepare for a meeting, coach internal staff, or review support trends.
| Report View | Best Used For |
|---|---|
| Last 30 Days | Recent support activity, completed tickets, first call resolutions, client follow-up, and current service trends. |
| Last 180 Days | Broader ticket history, service-performance review, SLA validation, pattern identification, and longer-term accountability. |
To export available data, open the applicable dashboard gauge or ticket detail view and select Export as CSV. Some on-screen drilldowns may display only the first 250 rows. The CSV export can be used to review the broader result set when available.
The dashboard is ideal for clients who want to review service activity on demand. Some organizations prefer a more hands-off approach. In that case, automated report delivery may be a better fit.
Reports can be scheduled for delivery to one or more appropriate recipients, such as:
This allows your team to receive recurring service information without needing to log in and export it manually.
| Option | Best Fit |
|---|---|
| Dashboard + CSV Export | Teams that want flexible access and prefer to review or export information when needed. |
| Automated Email Delivery | Teams that want recurring reports delivered automatically to designated recipients. |
If you would like additional report automations configured, contact your account manager. They can help coordinate the appropriate report, recipients, and delivery schedule for your organization.
Client dashboard access is intentionally read-only. You can review your assigned dashboard and supported ticket drilldowns without changing the underlying gauges, calculations, service records, or dashboard configuration. This allows both teams to review the same information while preserving the integrity of the reporting environment.
The dashboard is not intended to replace normal support communication. If you need help with an active request, have new information, believe the priority has changed, or need assistance sooner, use the normal support process. The dashboard also should not be interpreted as a single score that determines whether an individual ticket was good or bad. Support requests vary significantly in urgency, complexity, scheduling, dependencies, and required client participation.
The dashboard provides context. Individual tickets provide the detail behind that context. For more information about how support requests are processed, updated, followed up, completed, and reopened, review our IT Support Ticket Process.
We believe the strongest IT relationships work as one coordinated team. That requires visibility on both sides.
| What We Can See Together | Why It Matters |
|---|---|
| A service target was met | The recorded result provides objective confirmation. |
| A service target was missed | We can identify the affected tickets and understand what happened. |
| A ticket is waiting on the client | Your team can identify where a response may help move work forward. |
| A ticket needs discussion | Both teams can open the same recorded history instead of relying on memory. |
| A pattern develops over time | We can discuss the pattern and identify practical opportunities to improve together. |
Visibility → Accountability → Discussion → Improvement
The purpose of the dashboard is not to assign blame. It is to give both teams a fair and transparent view of the recorded service experience so we can make better decisions together.
No. Client dashboard access is read-only.
Often, yes. Click a supported statistic, chart section, or data point to open its configured drilldown.
Some dashboard values are calculated from multiple underlying measurements. Calculated results may not provide the same direct ticket-level drilldown as standard gauges. Related dashboard metrics and the Ticket Performance Detail section can be used to review the underlying activity.
The applicable SLA milestone may not have been recorded yet. Null does not automatically mean the SLA was missed.
The dashboard and its underlying datasets refresh periodically. Recent ticket activity may take some time to appear.
Yes, where the dashboard provides an Export as CSV option.
No. Continue using the normal support channels to request help, provide updates, change priority, or discuss an active ticket.
After your initial account activation, bookmark and use the direct EasyITGuys BrightGauge dashboard portal: https://easyitguys.brightgauge.co/dashboards/
The dashboard gives your team and ours a common source of recorded service information.
That shared visibility creates fair accountability on all sides. It also gives both teams better information for deciding what should happen next.
One team. Shared information. Clear accountability. Continuous improvement.


